

Priced Out: How Much More Are People Paying for Health Care in 2026? | The Waiting Room
Inside the massive out-of-pocket shifts in Alabama, Alaska, and Arizona—and why PacificSource is leaving the individual market.

Charles Gaba is a health care analyst who tracks policy and politics at ACASignups.net. Subscribe to his Substack!

Greetings, Lincoln Square readers!
Today I’m launching a new cost analysis project which looks at the total increase in healthcare spending that the ~19 million or so ACA marketplace enrollees who managed to cling to their coverage are facing this year due to Trump Regime/Congressional GOP actions (and inaction).
But first, here’s some other recent developments …
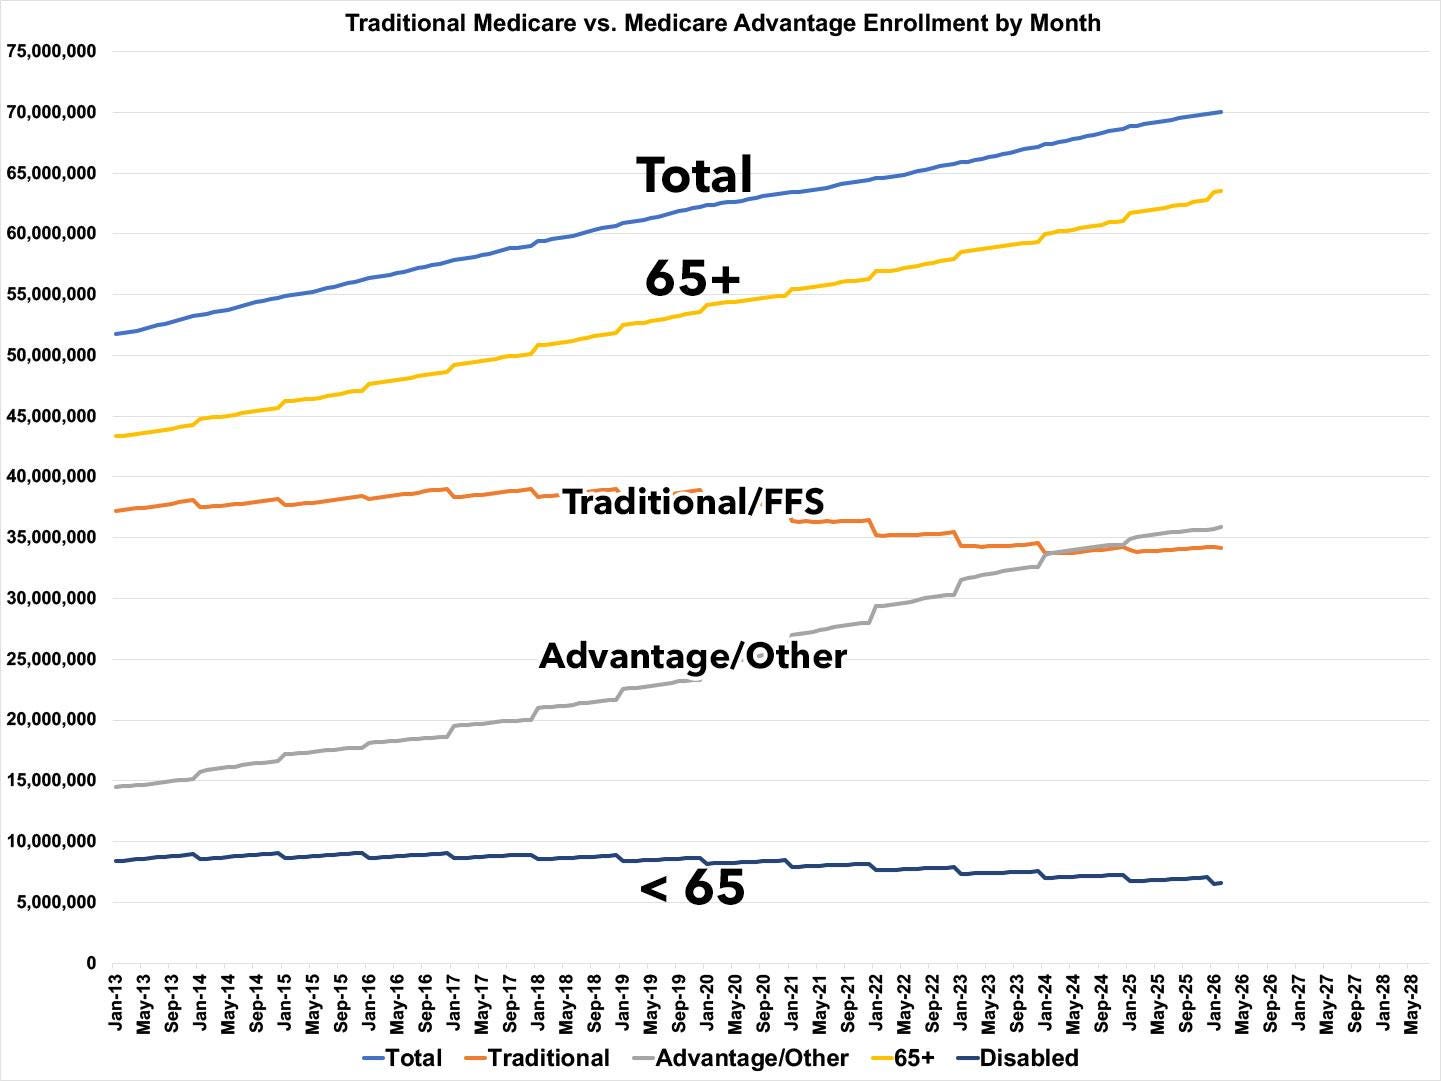
CMS posts February 2026 Medicare data; enrollment breaks 70M; Advantage breaks 51% of total market
Medicare Advantage (technically “Medicare Part C“ & originally called “Medicare+Choice”) is a type of health plan in the United States offered by private companies as part of the original Social Security Act of 1965 that created Medicare. It permits a private insurance option that wraps around traditional Medicare. Medicare Advantage plans attempt to fill some coverage gaps and offer alternative coverage options.
Under Part C, Medicare pays a plan operator a fixed payment for each enrollee. The operator then pays for their medical expenses. Traditional Medicare directly compensates providers on a fee-for-service basis. Plans are offered by integrated health delivery systems, labor unions, non profit charities, and health insurance companies, which may limit enrollment to specific groups of people (such as union members).
Medicare Part C/Advantage only covered around 2.8% of total Medicare enrollment as of 1986, then gradually grew to around 18% by 1999. After that it dropped off before growing again to cover roughly 1 out of 4 Medicare enrollees as of 2010, when the Affordable Care Act was passed. Since then, it has grown to the point that as of a year or so ago it crossed the 50% threshold, making it the default choice of Medicare enrollees.
The Centers for Medicare & Medicaid Services (CMS) just published updated enrollment data for Medicare, adding February 2026 to the data archive.
According to the latest report, as of February 2026:
Total Medicare beneficiaries broke 70 million, up just 6.8K enrollees month over month
Traditional (Fee for Service) Medicare beneficiaries are at 34.18 million (down ~152K m/m)
Medicare Advantage beneficiaries are at 35.87 million (up ~159K m/m)
11.75 million Medicare enrollees (16.8% of the total) were “Dual Eligibles”...that is, enrolled in both Medicare and Medicaid. Dual eligibles have seen a sharp drop over the past year, falling by nearly half a million people since July 2025.
Likely related: The number of Medicare enrollees under the age of 65 has actually dropped by more than 500,000 people since December.
Here’s how Medicare Advantage enrollment has grown (and how traditional “Fee for Service” Medicare has shrunk) over time.
It’s also worth noting that, given the Trump Regime’s obsession with erasing any reference or data regarding gender, race or ethnicity, the Medicare enrollment reports still include breakouts of those demographic factors.
Oregon: Providence announces they’re Ore-gone: ~440,000 to lose healthcare coverage next year
Providence to end most health insurance plans, forcing hundreds of thousands in Oregon to switch
Providence Health & Services plans to exit most of its Oregon health insurance business next year, citing rising costs, tougher regulation and intensifying competition from national insurers — a move that will force hundreds of thousands of Oregonians to find new coverage.
Leaders of the Renton, Washington-based health system announced the decision Wednesday, saying Providence will stop offering most plans through Providence Health Plan, including individual, family and employer coverage, as it seeks to strengthen its financial footing and refocus on delivering care rather than operating an insurance arm.
Jesus. When I first read the headline, I assumed this was only referring to them pulling out of the ACA market, where they had around 40,000 enrollees last year ... but apparently they’re pulling up stakes in the employer market as well.
How many people are we actually talking about?
Providence Health Plan, based in Portland, is Oregon’s third-largest health insurer, covering more than 421,000 Oregonians. It also covers over 13,000 members in Washington and 4,800 in California.
Yikes. That’s around 438,000 people total.
... Most members will keep their current coverage through the end of 2026, giving employers and policyholders time to transition. Providence said it will stop renewing employer group plans as contracts expire but will honor existing agreements.
So who exactly does that leave for them to “refocus on delivering care” to?
Providence officials said the insurance arm plans to continue serving its roughly 55,000 Medicare Advantage members through a partnership with a national insurer, though that agreement is still being finalized.
Providence also plans to transfer administration of its Medicaid and Medicare supplemental plans to other organizations, which serves roughly 62,900 Oregonians, but officials did not identify potential partners.
OK, so that’s actually more like 556,000 enrollees total, although it sounds like these populations won’t actually lose coverage.
Still ... so they’re not even gonna be covering Medicaid, Medicare or MediGap enrollees anymore??? What’s left?
... Providence is Oregon’s largest hospital chain, operating eight hospitals and more than 90 clinics across the state.
Ahhhh, there it is.
Having the same company own both the healthcare providers as well as the health insurance arms has always seemed like a bad idea to me (for the massive conflicts of interest alone), but this does seem like a bit of a Monkey’s Paw “be careful what you wish for” type of situation ...
Oregon & Montana: Another one bites the dust: PacificSource pulling out, another ~32,000 enrollees to lose coverage
Just a few days after the news about Providence Health, there was another blow to the Beaver State’s health insurance market. Via Nick Budnick of The Lund Report:
PacificSource, the Oregon-based health insurer, is pulling out of Montana and leaving the individual market while cutting staff.
The number of people who could be affected in this new round of layoffs is unclear, but this week the not-for-profit slashed four high-level executives. Based on the types of plans affected by the insurer’s latest restructuring some dozens more pink slips are expected to go out starting next week.
Headquartered in Springfield and founded in 1933, PacificSource was once a favored health plan relied upon by state and local governments for coverage. But it has suffered major losses, including in the Medicaid-funded Oregon Health Plan, causing it to reluctantly pull out of Lane County early this year, lay off hundreds and slash provider reimbursements while complaining that the state was not paying adequately to provide care for lower-income Oregonians.
I don’t know exactly how many Oregonians or Montanans will be impacted by PacificSource pulling up stakes, but as of spring 2025 they had around 21,000 effectuated ACA exchange enrollees in Oregon and around 11,500 in Montana. All current enrollees in both states will have to shop around this November for coverage from a different insurance carrier starting January 1st, 2027.
As of this writing, their options in Oregon have dropped from 6 to 4 (BridgeSpan, Kaiser Foundation, Moda Health Plan and Regence BlueCross BlueShield). In Montana there are only two other carriers offering ACA plans: HCSC (Blue Cross Blue Shield of Montana) and the Mountain Health Co-Op (which itself pulled out of Wyoming this year).
Between Providence and PacificSource, based on 2025 enrollment, over 60,000 Oregonians, or 38% of the state’s total individual market, will have to shop around.
Some Good News: Oklahoma GOP won’t move to kill Medicaid expansion this year after all
In the last edition, I noted that the Republican-controlled Oklahoma legislature was trying to push through a convoluted process with the hopes of eliminating the state’s expansion of Medicaid under the Affordable Care Act, which is currently providing healthcare coverage to over 230,000 low-income residents. The program was expanded via a statewide ballot initiative vote back in 2020.
Since then, however, it looks like this scheme to reverse Medicaid expansion has fallen apart after significant resistance and backlash:
Oklahomans will not vote in 2026 on proposed constitutional changes tied to Medicaid expansion after lawmakers failed to advance the measures before the legislative session ended.
… Lawmakers did not place either proposal on the ballot before the Legislature adjourned.
… “I am glad that we continue to protect Medicaid, and we protect the will of the voters. Even though I know that that was not the priority for Republicans,” House Minority Leader Cyndi Munson told Hetrick.
Last week, Pluribus News published a new story about effectuated enrollment across a dozen or so states (the reporters actually consulted with me several times about their data and how to present it, although I somehow didn’t end up getting credited in the final version).
Most of the material in their story is stuff I’ve been warning about for months, and even the enrollment data they acquired is the same as what I have in most cases. They were, however, able to get ahold of hard data for three states which I didn’t already have: Arkansas, Nevada, and Vermont.
ARKANSAS: Premium alignment mitigates the damage
As of May, Arkansas effectuated enrollment stands at 138,440, down ~5.2% vs the same point a year earlier. This is a fairly modest decline compared to most states, and the main reason for this is no doubt that AR is one of three states (along with IL and WA) which has newly-implemented robust Premium Alignment pricing to help cut down premiums for tens of thousands of enrollees.
When you further break things out by CSR category, however, it’s not quite as rosy...a big chunk of those moving to Gold did so by dropping their high CSR Silver, meaning they actually lost value (although this was necessary in order to save on premiums):
NEVADA: “Battle Born” plans not helping much
As of May, Nevada’s effectuated enrollment stands at 92,271 people, down over 11% y/y. Nevada became the third state to launch what they call a “state public option” this year, which they’ve branded as “Battle Born State Plans” for whatever reason:
I last wrote about Nevada’s initiative four years ago; at the time it really was supposed to be a true Public Option (that is, a major medical healthcare plan administered by the state itself which anyone could buy into at a more competitive price than private plans).
Unfortunately, since then the program has ended up being watered down quite a bit:
Nevadans looking for health insurance on the state’s Affordable Care Act marketplace this fall have a new, more budget-friendly option to review: Battle Born State Plans.
... Approximately 35,000 people are projected to purchase the Battle Born Plans, a number that could vary given rising health care costs and the expiration of certain federal subsidies.
Basically, like in WA & CO, the state contracted with several private insurance carriers to create a new category of ACA-compliant Qualified Health Plans (QHPs) to sell on the exchange. They have to meet the same requirements as any other exchange plan, except that they’re legally required to hit certain premium reduction targets. That’s pretty much the only distinction besides the branding.
... Insurance carriers offering the plans are required to align their networks with Medicaid managed care networks to ensure sufficient access to care.
... Under Nevada law, carriers offering the new state plans must satisfy premium reduction targets over the next four years, finishing at 15 percent lower than the average premium on the market.
So far it doesn’t look like the new “Battle Born” plans are having much of an impact, at least on enrollment.
VERMONT: Premium Alignment and State Subsidies make for a mixed bag
As of April, Vermont’s effectuated enrollment stood at 28,535 people, down 11.5%.
Unlike most states, enrollment below the poverty line actually increased this year, although the raw numbers show that this is pretty much a rounding error. While there has definitely been a “buying down’ trend in Vermont, it wasn’t nearly as strong as in most states I’ve looked at so far--there’s been more of a “ripple effect” here, with people downgrading one tier but not always two or three...in fact, the largest increase in enrollment is to standard Silver (not including Catastrophic plans, but again, the numbers are nominal).
Vermont is a state which already has Premium Alignment pricing and which also has their own supplemental state subsidies in place, which muddies the water somewhat as well.
NEW PROJECT: How much more are ACA enrollees *really* paying due to Trump/GOP policies this year?
Regular readers know that I’ve been obsessing over the massive increases in both gross as well as net premiums for ACA health insurance policy enrollees being caused by the combination of Congressional Republicans allowing the enhanced federal tax credits to expire as well as other Trump Regime* policy changes for well over a year and a half now.
*(Yes, even GOP U.S. Senator Dave McCormick refers to it as a “regime.”)
I’ve written countless analyses of how much both gross and net premiums skyrocketed from 2025 to 2026 across different states, different income levels and various other demographics ... and last week it was revealed that over 3 million ACA exchange enrollees had already been priced out of the market as of April, with the number almost certain to climb further throughout the rest of 2026.
As I’ve repeatedly warned, however, the increases in premium costs (whether gross or net) are only half the story. The other big shoe which is dropping this year is increased out of pocket costs as millions of the ~19.2 million or so remaining enrollees as of April have been forced to downgrade their coverage to avoid (or at least minimize) those massive premium spikes.
In most cases this means moving to plans with higher deductibles, higher co-pays and higher coinsurance costs. In many cases this has also included moving to plasn with worse networks, referral requirements to see specialists and so on.
With that in mind, I’ve decided to attempt to calculate the average year over year increase not just in net premiums (that is, how much more ACA enrollees are having to pay each month) but also the year over year change in average out of pocket costs.
Average net premiums are easy to calculate, since the Centers for Medicare & Medicaid Services (CMS) has already published Public Use Files including the average gross and net premiums which all ~23.1 million people who selected exchange coverage during the Open Enrollment Period (OEP) are being charged.
The second—actual out of pocket expenses—are a lot trickier, but I’ve come up with a formula which seems to be fairly accurate. It gets wonky, and you can see the full methodology here, but it basically boils down to a) calculating the average Actuarial Value (AV) of the entire ACA market within each state and then b) using that AV to estimate total average medical expenses in both 2025 and 2026.
It’s also worth noting that just as I started this project, healthcare policy/data firm KFF published a new analysis of actual 2026 ACA enrollment and determined that average ACA Marketplace deductibles actually increased by a whopping 37% (or $1,027 per person) to a record high of $3,786 in 2026...which only serves to underscore the entire point of my own project.
Here’s what it looks like for the first three states (yes, I’m doing this alphabetically):
ALABAMA:
The average 2026 Alabama ACA enrollee will have to pay an average of around $1,500 in premiums plus another $2,300 or so in OOP costs this year, or ~$3,800 total, compared to ~$2,200 last year. That’s $732 more in premiums plus an additionaL ~$830 or so in out of pocket expenses in the form of deductibles, co-pays & coinsurance payments, making their actual healthcare expenses over $1,500 higher this year on average.
ALASKA:
Alaska is also one of just two states which saw gross premiums drop overall this year, by 5.6% on average...not that this did much to help with the net premiums actually paid by the enrollees: Overall, the ~26,000 Alaskans who signed up during Open Enrollment (over 2,600 fewer than last year) saw their average net premiums skyrocket by over 54%.
The saving grace (of sorts) is that overall, Alaska enrollees were actually able to keep their average out of pocket costs nearly the same, only going up 2.5%. Combined with the premium spike, this means their total healthcare expenses jumped up by around 25% overall...from ~$6,200 to over $7,700 apiece.
ARIZONA:
In Arizona, not only have Open Enrollment plan selections dropped by more than 15% to begin with, the ~357,000 who did sign up were hit with a whopping DOUBLING of their average net premiums, from $1,356 to $2,748 per year...a 103% increase.
In addition, however, Arizonan ACA enrollees are also being hit with what appears to be a 73% average increase in out of pocket costs...jumping from around $1,500 last year to over $2,600 this year.
Combined, on average, Arizona enrollees are paying an additional ~$2,500 in healthcare costs this year...an 87% hike to over $5,300 net per enrollee.
And with that, I’ll see you in another two weeks …