


Charles Gaba is a health care analyst who tracks policy and politics at ACASignups.net. Subscribe to his Substack!
Greetings, Lincoln Square readers!
I had to skip last week as I was out of town picking up my kid from college for the summer, so there’s actually three weeks of healthcare policy insanity to catch up with …
The last edition included the first half of my deep, wonky dive into the final, official 2026 ACA Open Enrollment Period data, slicing and dicing up the enrollment numbers by a whole mess of demographic criteria. Today, I’m wrapping up the 2026 OEP analysis, along with some more recent developments …
My remaining Open Enrollment data breakout is by household income bracket. For 2026, the annual Federal Poverty Level (FPL) is set at the following income levels for every state except Hawaii and Alaska, where the dollar amounts are 15% and 25% higher, respectively:
1 in household: $15,650
2 in household: $21,150
3 in household: $26,650
4 in household: $32,150
The key FPL income “break points” for ACA enrollment are 100%, 138%, 200% and 400% due to how both the federal tax credit formula as well as Medicaid expansion rules work under the Affordable Care Act. I’ve grouped the income levels as follows:
Under 138% FPL:
100% FPL is a key threshold because most enrollees aren’t eligible for federal tax credits if they earn less than that. This is due to a classic case of “the best laid plans” during the passage of the ACA: The original language of the bill called for every state to expand Medicaid to all documented residents earning up to 138% FPL, which would presumably mean that no one earning less than that would have any need of subsidized private exchange coverage.
Instead, the Supreme Court ruled in 2012 that expanding Medicaid to those earning up to 138% FPL had to be left up to each individual state…and as of this writing, while 40 states and D.C. have done so, there are still 10 states (9 out of 10 of which have GOP trifectas) which are still refusing to do so over 15 years after the ACA became law.
This means that there are several million dirt poor Americans caught in the so-called “Medicaid Gap” in which they aren’t eligible for Medicaid but also aren’t eligible for any financial assistance to buy private insurance on the ACA market.
Due to an odd quirk of snippets from different versions of the original ACA legislative text ending up in the final version of the bill, however, there’s an “overlap” population of people who earn more than 100% but less than 138% FPL. In the 41 Expansion states, these folks are mostly enrolled in Medicaid anyway, but in those 10 Non-Expansion states (AL, FL, GA, KS, MS, SC, TN, TX, WI, WY), that quirk is a literal lifesaver for many of them: They aren’t eligible for Medicaid, but they are eligible for heavily-subsidized ACA exchange coverage instead.
You’ll note that I said that most enrollees who earn less than 100% FPL aren’t eligible for federal tax credits. There’s actually a small population below the Federal Poverty Line of several hundred thousand people who were eligible for them until recently, which mostly includes documented (ie, lawfully-residing) immigrants who aren’t eligible for Medicaid due to living in the United States for less than five years.
Unfortunately, via both Trump Regime policy changes as well as last year’s Big Ugly Bill (H.R. 1, officially the “One Big Beautiful Bill Act”), that exception is now gone.
As a result, exchange enrollment below the 100% FPL threshold plummeted by a whopping 45% this year, from ~549,000 to just 305,000 individuals. This includes nearly 78,000 losing coverage in Georgia alone and over 50,000 in Florida.
As for the 100-138% FPL population, a stunning 32% of all ACA exchange enrollees fall into this income bracket. This may sound surprising given that, again, Medicaid expansion provides coverage for residents who earn up to 138% FPL ... until you remember that the 10 Non-Expansion states 10 states include Texas, Florida and Georgia. In fact, if the 10 holdout states were to ever actually expand Medicaid properly, up to ~7.4 million ACA enrollees would shift over to Medicaid coverage while ACA exchange enrollment would drop by a similar amount.
While enrollment under 100% FPL has fallen off a cliff, enrollment in the 100 - 138% FPL bracket actually increased by about 4.6%.
100 - 200% FPL:
(Note: This includes the 100 - 138% overlap population)
A full 64% of all exchange enrollees (~14.8 million) fall into this income range, the vast majority of whom really should be enrolled in Silver plans since, at incomes below 200% FPL, they’re eligible for generous Cost Sharing Reduction assistance which boosts Silver plans up to “Secret Platinum” status: If they earn up to 150% FPL Silver plans have a 94% Actuarial Value; if they earn 150 - 200% FPL Silver is boosted to 87% AV.
In layman’s terms, High CSR Silver plans have either free or extremely low premiums along with extremely low deductibles & co-pays.
Unfortunately, only 9.85 million enrollees chose Silver this year. .. and even then, not all of them are in the 100 - 200% FPL range, which means there’s quite a few who left hundreds or thousands of dollars in financial assistance for out of pocket costs on the table...except that with the enhanced federal tax credits having expired, many of these folks may have had no choice due to the increase in their premiums.
Enrollment in the 100 - 200% FPL range dropped by over 415,000 people, or 2.7% nationally, although there are 16 states where it actually increased, and 5 states (all blue, all operating their own exchanges) where it increased by double digits: NJ, MA, MD, CT & NM. However, there’s also several states which saw 100 - 200% FPL enrollment drop by 20% or higher, including NC, WV, OH & VT.
200 - 400% FPL:
Around 25% of all ACA exchange enrollees earn between 200 - 400% FPL. Plan selections in this bracket “only” dropped by around 128,000 people for three reasons:
While their premiums still jumped dramatically, they did so by less than those earning less than 200% or more than 400% FPL.
The elimination of subsidy eligibility for recent immigrants doesn’t apply to this income range anyway.
The third reason is likely due to a substantial number of enrollees who normally earn a little bit more than 400% FPL ($62,600/yr if single; $128,600 for a family of four) making a dangerous gamble by projecting their 2026 income to be less than 400% FPL in order to cling to the (less generous) tax credits…and then scrambling to ensure that their 2026 Modified Adjusted Gross Income (MAGI) does indeed end up below the 400% threshold.
They may do this via several perfectly legal means, such as maxxing out their Health Savings Account (HSA) contribution, maxxing out their Individual Retirement Account (IRA) contribution and/or other means.
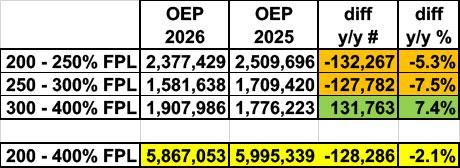
You can see this pretty clearly in this table which breaks out the 200 - 400% range further: Plan selections dropped substantially at the 200 - 250% and 250 - 300% brackets…but increased 7.4% from 300 - 400%. I don’t have more granular data, but I’d be willing to bet that nearly all of that increase is actually in the 390 - 400% FPL range:
The danger of doing this, of course, is that if your actual 2026 MAGI household income ends up coming in over 400% FPL after all, you have to pay back every cent when you file your 2026 taxes next spring, which in some cases could be tens of thousands of dollars.
Over 400% FPL:
Finally, there’s nearly 1.1 million exchange enrollees who earn more than 400% FPL...although this total is actually closer to 2.15 million if you include enrollees whose household income is either “other” or “unknown.” The latter mostly consists of enrollees who don’t enter any projected income whatsoever (which I’m guessing means they earn well over 400% FPL & thus know they won’t qualify for any subsidies).
Plan selections between 400 - 500% FPL dropped by over 320,000 people, or a whopping 44% … although as I just noted, some of that is likely due to people projecting their 2026 income below the 400% line (and then sweating bullets to keep it below that). Another ~247,000 who earn more than 500% FPL dropped coverage as well.
ALL TOLD, that’s over 1.2 million fewer Americans who selected ACA exchange plans during the 2026 Open Enrollment Period … but as I’ve warned many, many times before, this vastly understates how many ACA enrollees actually lost coverage, which is an entirely different thing.
Right on cue, Wakely Consultants, one of the world’s leading actuarial firms, published a new analysis which supports my fears, pointing to “meaningful changes in enrollment, consumer behavior, and overall market morbidity as 2026 progresses.”
Drawing on data representing approximately 80% of the market, the findings highlight early indicators that could shape pricing, participation, and policy impacts heading into 2027.
The analysis finds that while initial plan selection data suggested only modest declines in enrollment, a deeper look at premium payment behavior tells a more complex story. On average, only 86% of enrollees paid their first premiums in January 2026, with significant variation across states.
What does this mean in real-world terms?
Enrollment declines may be more substantial than early data suggests.
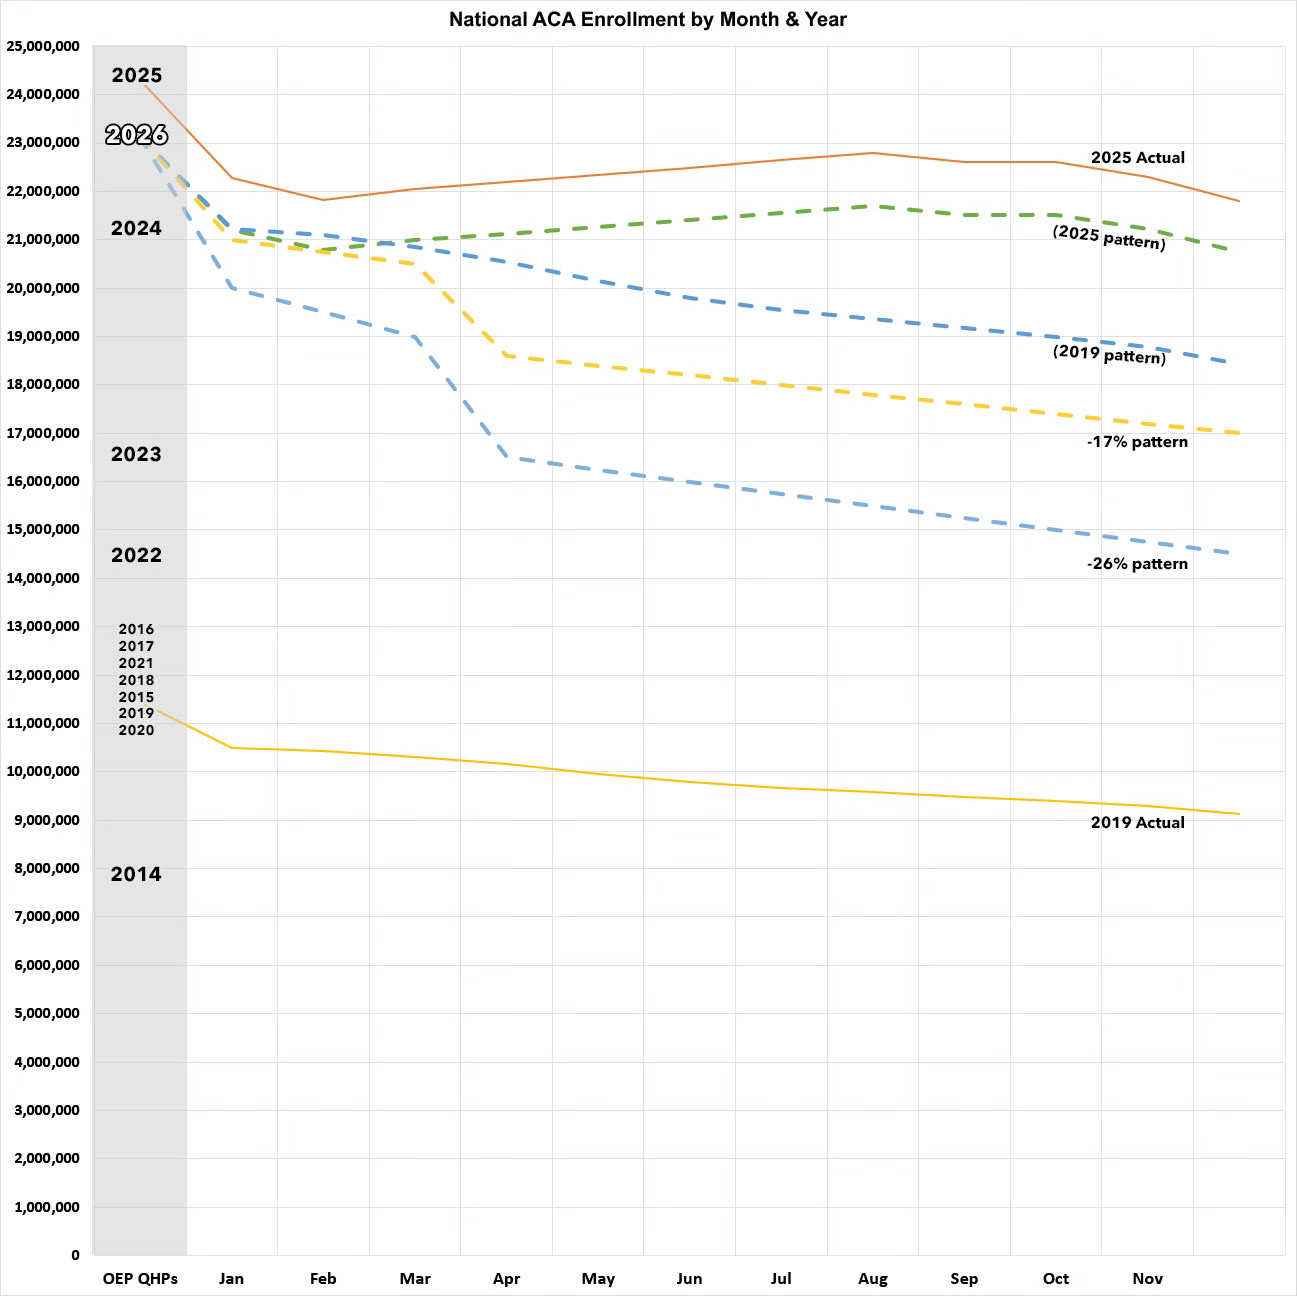
While plan selections declined by roughly 5%, actual enrollment is projected to fall between 17% and 26% on average when accounting for unpaid premiums and ongoing attrition. Some states may see reductions higher than 26%, with higher reductions skewing toward states operating under a Federally Facilitated Exchange.
Here’s what a 17% or 26% year over year effectuated enrollment drop would look like visually, along with what it would look like if enrollment over the course of 2026 follows the trend lines of 2025 or 2019:
Meanwhile, while detailed effectuated enrollment data for every state likely won’t be made available publicly until July, several of the states which operate their own ACA exchanges have been publishing monthly enrollment reports, and sure enough, the early data isn’t pretty:
Colorado: Q1 effectuated enrollment down 5.3% y/y; could drop by up to 9.1% or more by end of 2026
California: Effectuated ACA Enrollment Down 5.6% Y/Y; Could Drop By 12% Or More By End Of 2026
Massachusetts: OEP plan selections up 3.7% y/y...actual effectuated enrollment flat & dropping...
🚨 New Jersey: Effectuated ACA enrollment down 11.5% y/y; at least 57,000 have already lost coverage
…and most concerningly (so far)…
Georgia: Effectuated ACA enrollment down 28% y/y; at least 370,000 have already lost coverage
The early numbers from the first four states above aren’t great, but they’re relatively muted thanks to those states all implementing their own supplemental financial assistance which is helping mitigate the damage.
Georgia, on the other hand, has no such measures in place, which makes it likely to be far more representative of the trend lines in most states (it also doesn’t help that GA is among the 10 non-expansion states, meaning they have a much higher percentage of their enrollees below the 138% FPL threshold than expansion states do).
I had a lengthy discussion about this and other current issues with L O L G O P on his podcast recently.
In other news…
Illinois Announces New Tax Time Easy Enrollment Program; Pregnancy now qualifies for Special Enrollment Period
A couple of small but welcome bits of positive news out of the Land of Lincoln: Illinois has joined several other states in implementing a new “Tax Time Easy Enrollment” program allowing residents who don’t have healthcare coverage to simply check a box when filing their state tax returns indicating that they want help getting covered. The state will send them info about their eligibility status for either Marketplace coverage (and tax credits if applicable) or Medicaid … and they’ll be given a 60-day Special Enrollment Period (SEP) to apply & enroll.
In addition, Get Covered Illinois is joining some other states in making pregnancy a Qualifying Life Event which will make them eligible for a SEP as well.
Which costs more: Employer-Based Insurance or ACA coverage? The answer may surprise you ...
This was inspired by an (unnamed) Republican Congressman who claimed that ACA insurance policy premiums have increased by 26% per year on average since the law was passed, which was so laughably high (this would amount to a 4,000% increase since it was signed into law) that I decided to delve deeper into the issue.
My conclusion? Since 2009, average unsubsidized individual market premiums have indeed roughly tripled (~200% higher, which is still far less than 4,000%!) … but during the same time period, not only have group market (aka employer-sponsored insurance, or ESI) premiums more than doubled, they’re actually still higher on average than ACA premiums at full price!
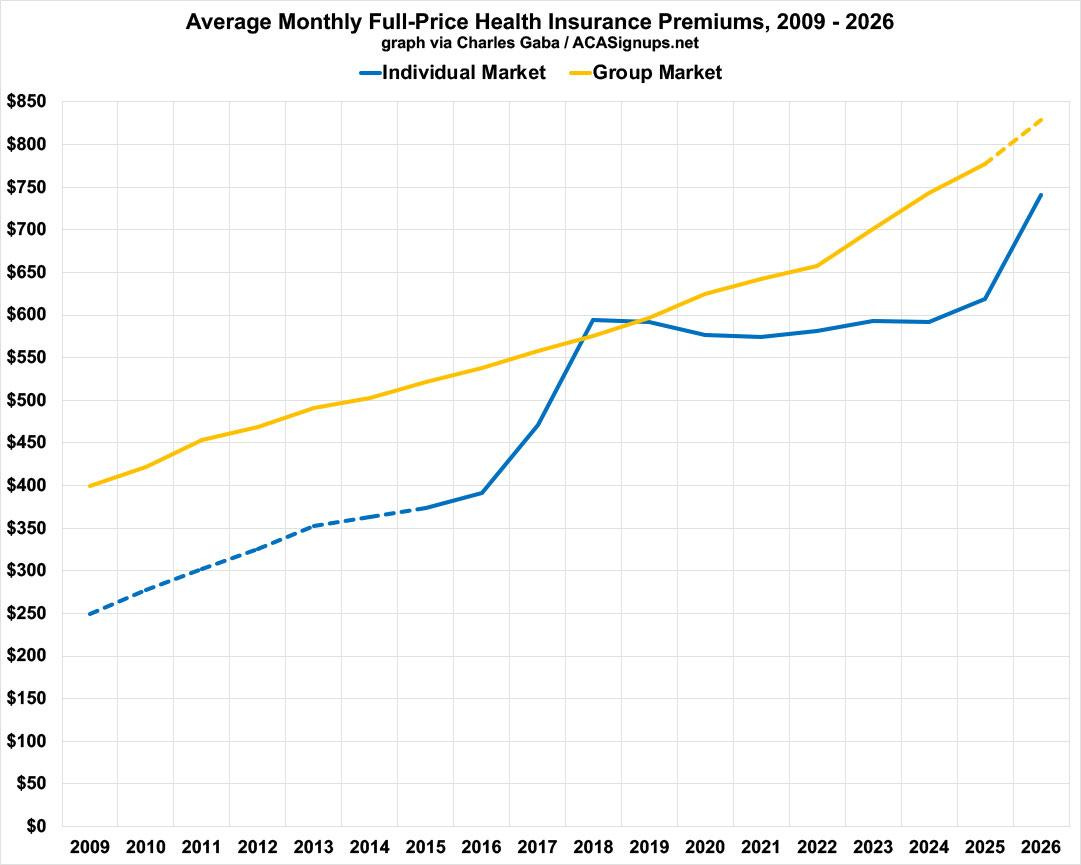
As for subsidized premiums, here’s what those look like on average…as you can see, the original ACA subsidy formula brought individual market premiums much closer to what average ESI enrollees actually pay out of pocket…and the enhanced tax credits added from 2021-2025 brought them down further until they pretty much reached parity.
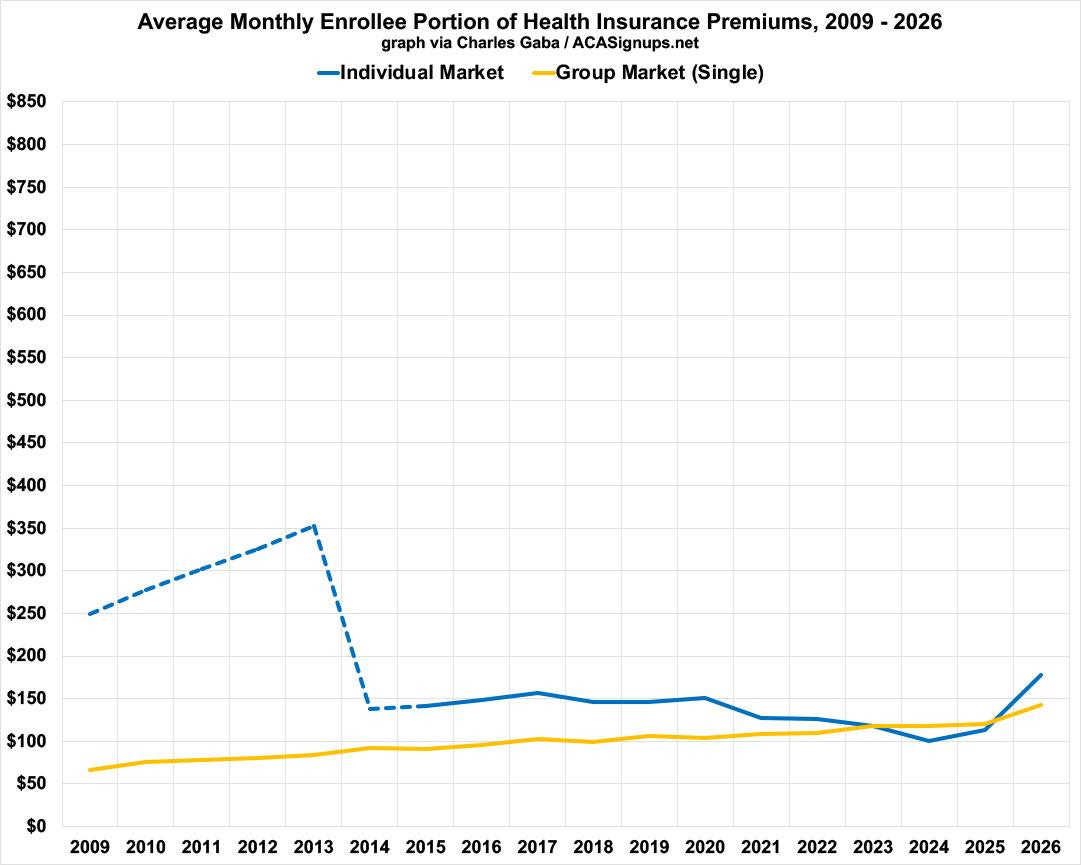
Unfortunately, the moment that the enhanced subsidies expired back in December, average net individual market premiums shot back up and are once again much higher on average than what those with employer plans pay.
CMS posts January 2026 Medicaid, CHIP & Medicare enrollment reports
After an all-too-brief drop in Medicare Advantage enrollment in December, MA enrollment roared forward again, continuing to increase its lead on traditional “fee for service” Medicare whether folks like it or not. Meanwhile, enrollment in Medicaid/CHIP has dropped by 4.2 million people under Trump 2.0 … and that’s before most of the uglier Medicaid provisions of the #BigUglyBill kick into effect.
Speaking of which …
Nebraska: Hey, remember when I warned that the Big Ugly Bill’s Medicaid cuts were gonna hit well BEFORE the midterms?
Well, guess what? Yes, that’s right: While most states won’t be implementing the so-called “work reporting requirements” until they’re legally required to starting in January 2027, three states are taking advantage of a “waiver” option included in the legislation which lets them launch the new program early.
Arkansas & Montana are launching theirs in July, but Nebraska is really eager to start kicking poor people off their healthcare coverage and has opted to go live TOMORROW (May 1st). Depending on your source, between 16,000-54,000 (23%-77%) of Nebraskans currently covered via Medicaid expansion are expected to be given the boot.
While I’m on the subject, here’s one of many examples of why the supposedly “reasonable” requirement that low-income Medicaid enrollees track and report their working hours to the state is not only likely to lead to massive numbers of them being kicked off the program even when they’re fully meeting the requirements, but that this is actually the entire point of instituting such requirements:
“Beware of the Leopard!” ~20% of Medicaid expansion enrollees would likely have no way of reporting their work hours ... by design
… according to the ACS, over 5.2 million U.S. households—3.9% of the total--still didn’t have any computer of any sort as of 2023—that means no laptops, desktops, smartphones or tablets of any kind.
In addition, over 10.3 million households--7.8% of the total still had no internet service of any type--broadband, DSL, satellite, fiber optic, cellular data or even dial-up.
… According to the 2023 ACS, a whopping 22.3% of households earning less than $20K/year didn’t have any type of internet service (or nearly 2.45 million), while 10.1% of households in the $25K-$75K range didn’t (3.39 million). Adding 1/3 of the $25K-$75K group, that means at least 3.6 million households with at least one Medicaid expansion enrollee would have no obvious way of reporting their “compliance” hours.
Since at least some of those households have more than one person enrolled in Medicaid via ACA expansion, it likely means more like 4 million actual enrollees.
That’s ~20% of the Medicaid expansion population.
And with that, I’ll see you again in two weeks … really, this time!